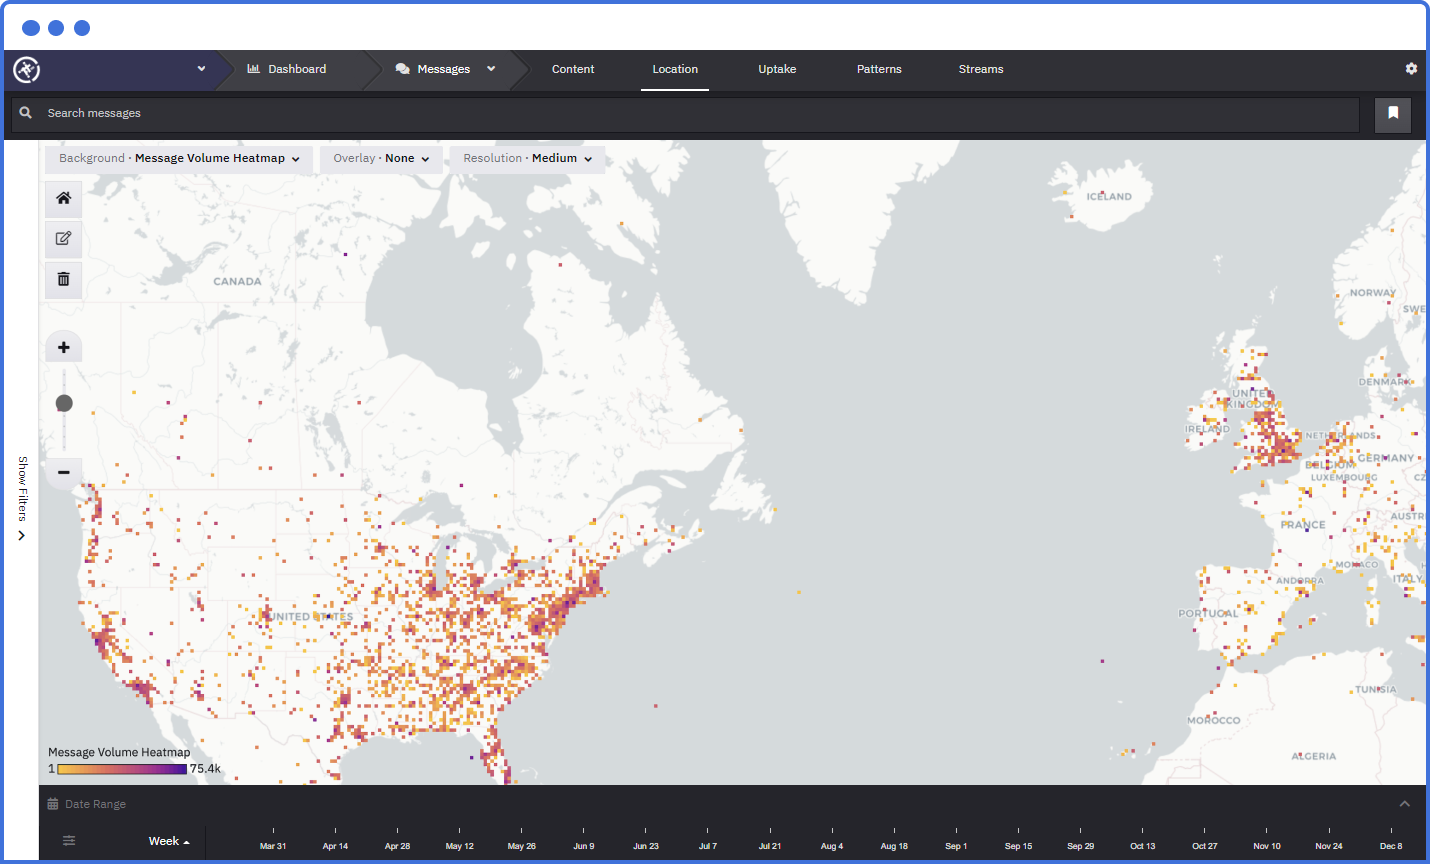
top of page
provenant_blue.png

REVOLUTIONIZE YOUR APPROACH TO UNDERSTANDING THE SOCIAL MEDIA LANDSCAPE

PanTera Icon_Graphic Outlined_Blue.png
arrow (2)_blue.png


Home: Welcome

Provenant™ is a novel platform for analyzing the landscape of millions of publicly available social media messages and understanding behaviors that shape online discourse. Provenant can reveal, aggregate and summarize population-scale behavioral patterns, trending themes, anomalies and external events.

location_view_blue_edited.png

POPULATION-SCALE
VISUAL ANALYTICS

Make sense of social media patterns through global-scale geospatial and temporal views of population activity correlated with key events.

SHAPE OF INFLUENCE

Highlight and track propagation and amplification of messages across the social media landscape to understand how they flare up and flame out.

update_view_blue_edited.png
pattern_view_blue_edited.png

CHARACTERIZE
ENGAGEMENT


Analyze the mountain of social media community responses to understand the effects of  messaging and other events.

BACKED BY RESEARCH

Backed by significant scientific research investment, the Provenant team works with research partners and stakeholders. Advancing the ability to understand the social impact of social media.

CROSS-CHANNEL ANALYSIS

Find patterns, narratives, and influence operations that span diverse big data streams. Identify coordinated activity across multiple social media channels.

SCALABLE AND EXTENSIBLE

A modular data collection and processing pipeline supports integration of new analytics or messaging platforms with limited operational impact.

RICH VISUAL ANALYTICS

Make sense of social media patterns through global-to-local scale geospatial and temporal views of population activity correlated with key events.

Research

ONGOING RESEARCH

Final 3-with dots_blue_edited.png

MESSAGING CAMPAIGN IMPACT ASSESSMENT

Qualitatively and quantitatively analyze messaging campaign efficacy through a combination of automated and manual comparisons of engaged and general populations.
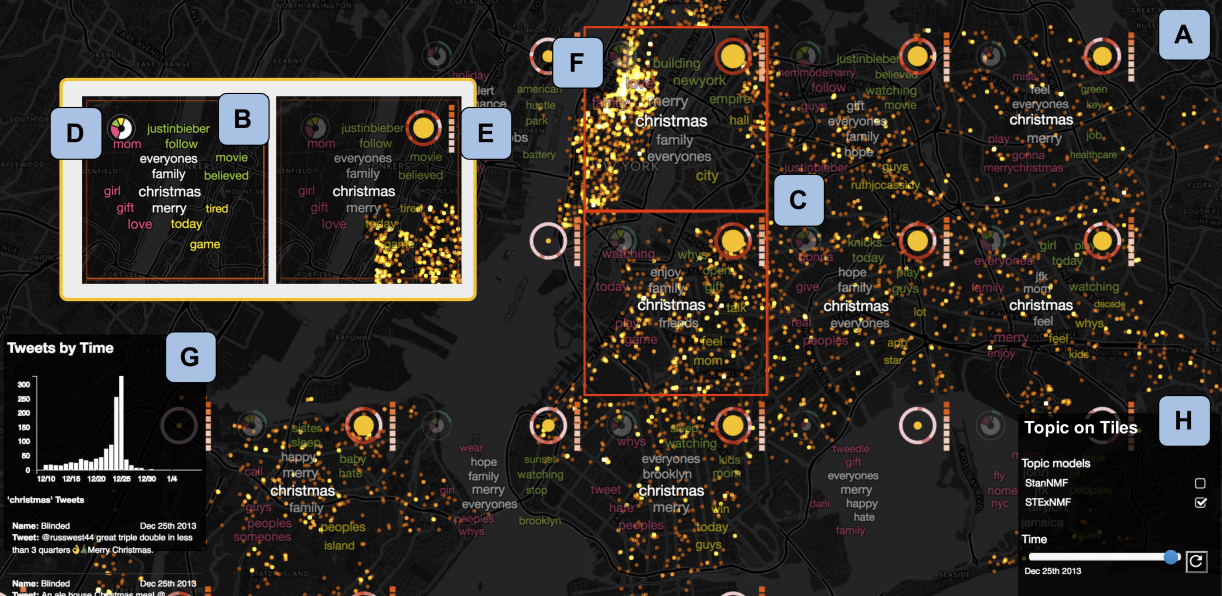
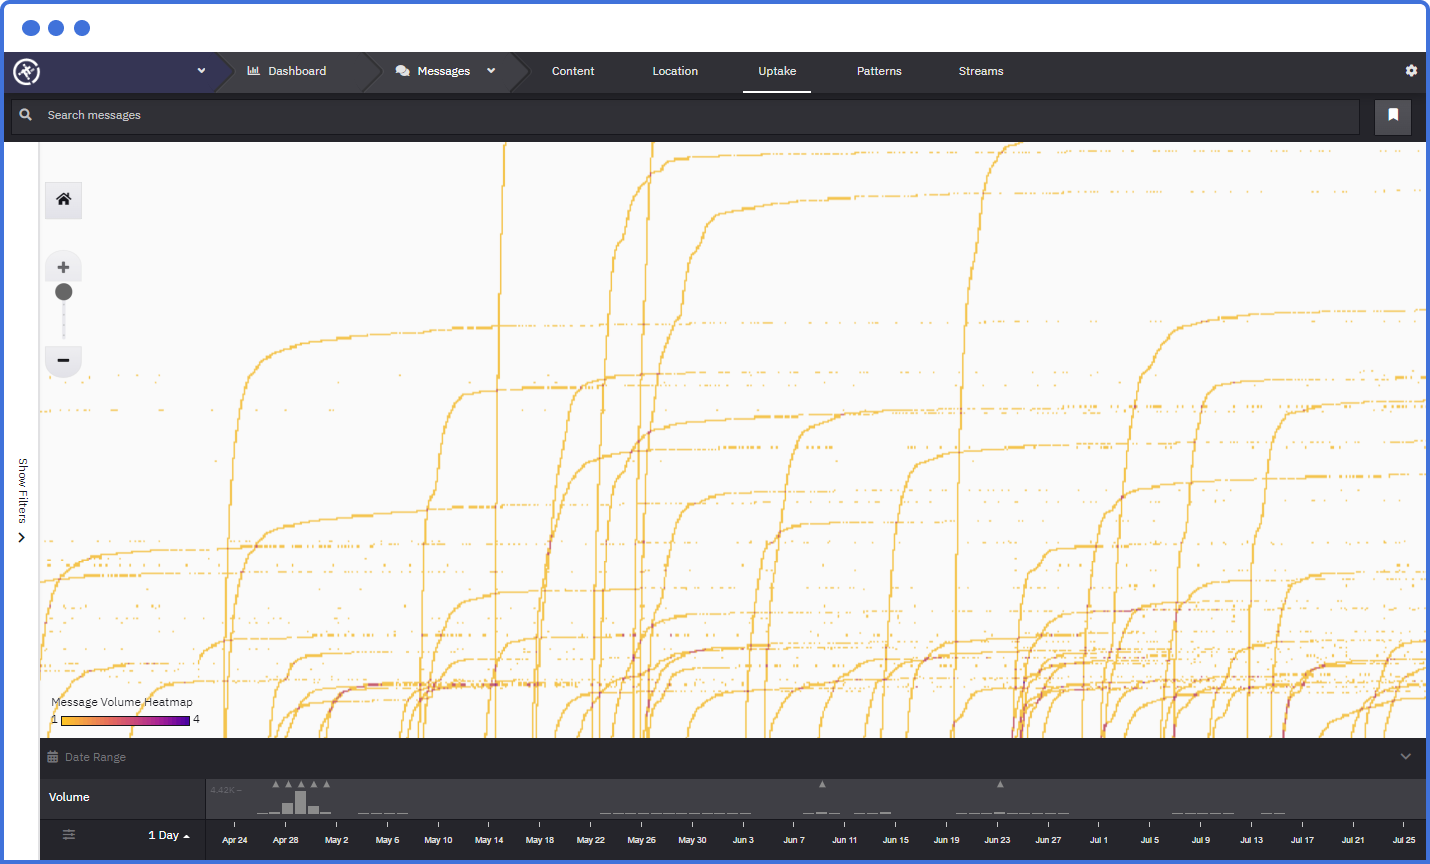
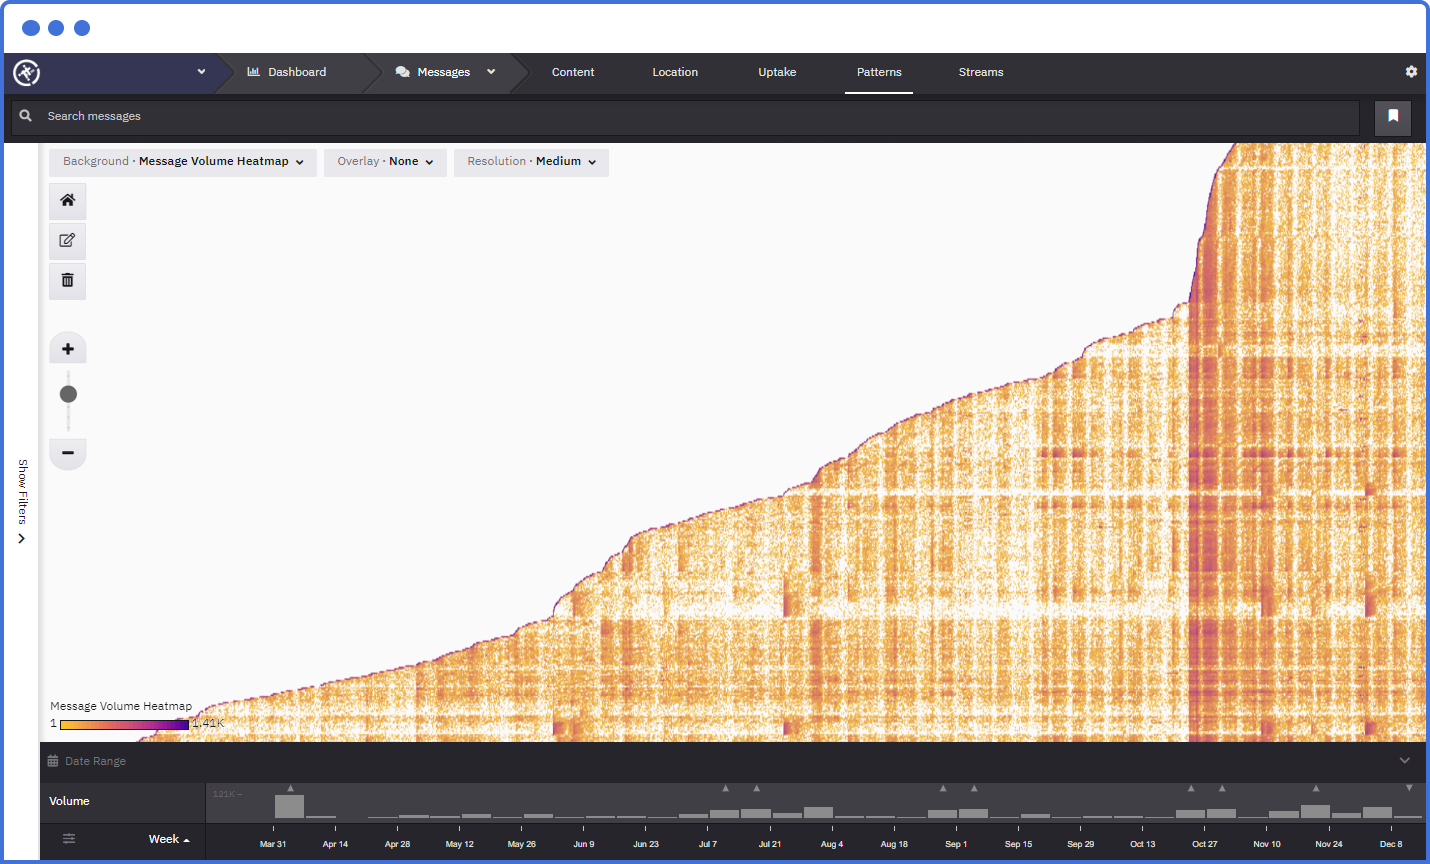
MESSAGING TREND ANALYSIS

Identify impactful messaging trends, trace their origins, and detect correlations.

INFLUENCER ANALYSIS

Discover key influencers in a target audience. Detect key aspects of influencer messaging tactics including bot and amplifier networks.


PROPAGATION NETWORK

Discover and analyze online community structures and how messages spread within them.

uncharted dot pattern_edited.png
Publications

PUBLICATIONS

TOPICONTILES: TITLE-BASED SPATIO-TEMPORAL EVENT ANALYTICS VIA EXCLUSIVE TOPIC MODELING ON SOCIAL MEDIA


Detecting anomalous events of a particular area in a timely manner is an important task. Geo-tagged social media data are useful resources, but the abundance of everyday language in them makes this task still challenging. To address such challenges, we present TopicOnTiles, a visual analytics system that can reveal the information relevant to anomalous events in a multi-level tile-based map interface by using social media data. To this end, we adopt and improve a recently proposed topic modeling method that can extract spatio-temporally exclusive topics corresponding to a particular region and a time point. 

View Paper

GRAPH MAPPING: MULTI-SCALE COMMUNITY VISUALIZATION OF MASSIVE GRAPH DATA
 

Graph visualizations increase the perception of entity relationships in a network. However, as graph size and density increases, readability rapidly diminishes. In this cover article for the July 2017 edition of the Information Visualization journal, we present an end-to-end, tile-based visual analytic approach called graph mapping that utilizes cluster computing to turn large-scale graph (node-link) data into interactive visualizations in modern web browsers.
 

View Paper

GLOBAL TO LOCAL PATTERN OF LIFE ANALYSIS WITH TILE-BASED VISUAL ANALYTICS
 

In this paper, we present in-progress work on applications of tile-based visual analytics (TBVA) to population pattern of life analysis and geo-temporal event detection. TBVA uses multiresolution data tiling, analytics and layered high-fidelity visualization to enable interactive multi-scale analysis of billions of records in modern web browsers through techniques made familiar by online map services. 

View Paper  |  View Poster

Contact
bottom of page